Benchmark Methodology
This page collects the performance numbers of charturbo (Rust + WebGPU/WebAssembly) measured with the web/bench/ harness, how they were measured, the chart comparison against uPlot · ECharts · Chart.js · Plotly · ChartGPU · SciChart · Highcharts, and the 3D graph comparison against three.js · deck.gl · cosmos.gl · 3d-force-graph. The numbers come from the single machine described below and will differ on other machines · browsers · displays. You can reproduce them yourself with the same commands.
- Latest raw results:
docs/bench/results.json,results.md. The number tables in sections 4–6 below are the initial measurement record of 2026-10-26; read later library additions and corrected measurements from the raw results and the live comparison page. - The engine's own scenarios keep the 2026-10-26 record. Cross-library comparisons are re-measured after adapter fixes with 5 runs (+1 warm-up) and a 3-second steady state. The time · version · settings of each run are recorded in each entry's
measurement, and the actual sample count inresult.ttff.frame.n. - The product name is Charturbo.
vizandvizgpuin the raw measurements and the benchmark CLI are the existing identifiers of the Charturbo CPU and hybrid GPU paths, kept so the measurement records stay linked.
Results drawn with our own SDK, and design settings
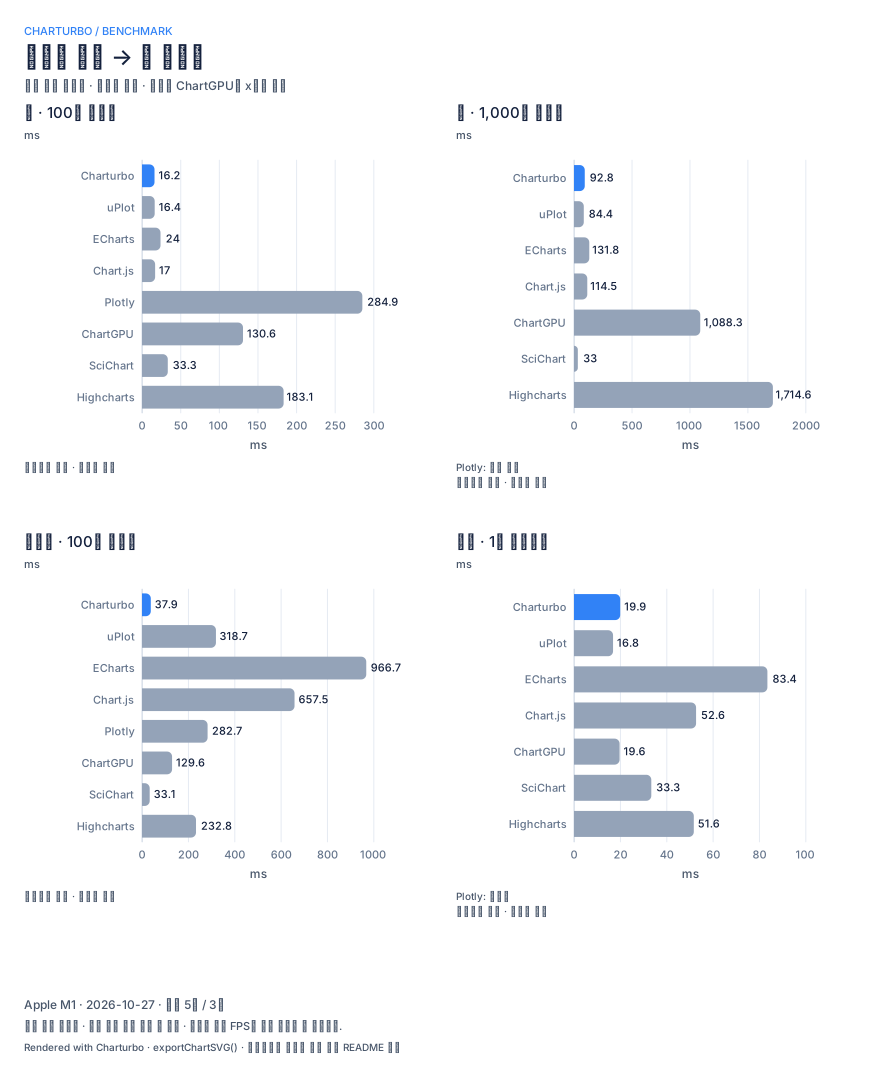
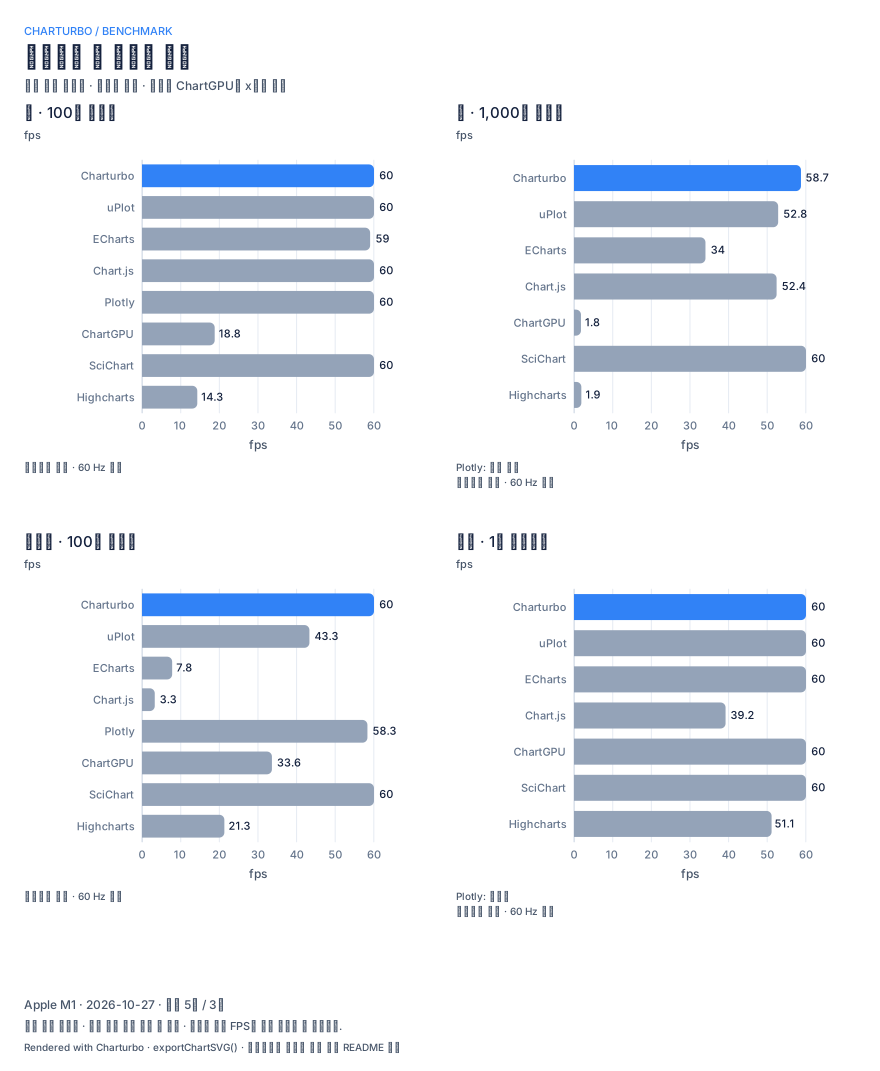
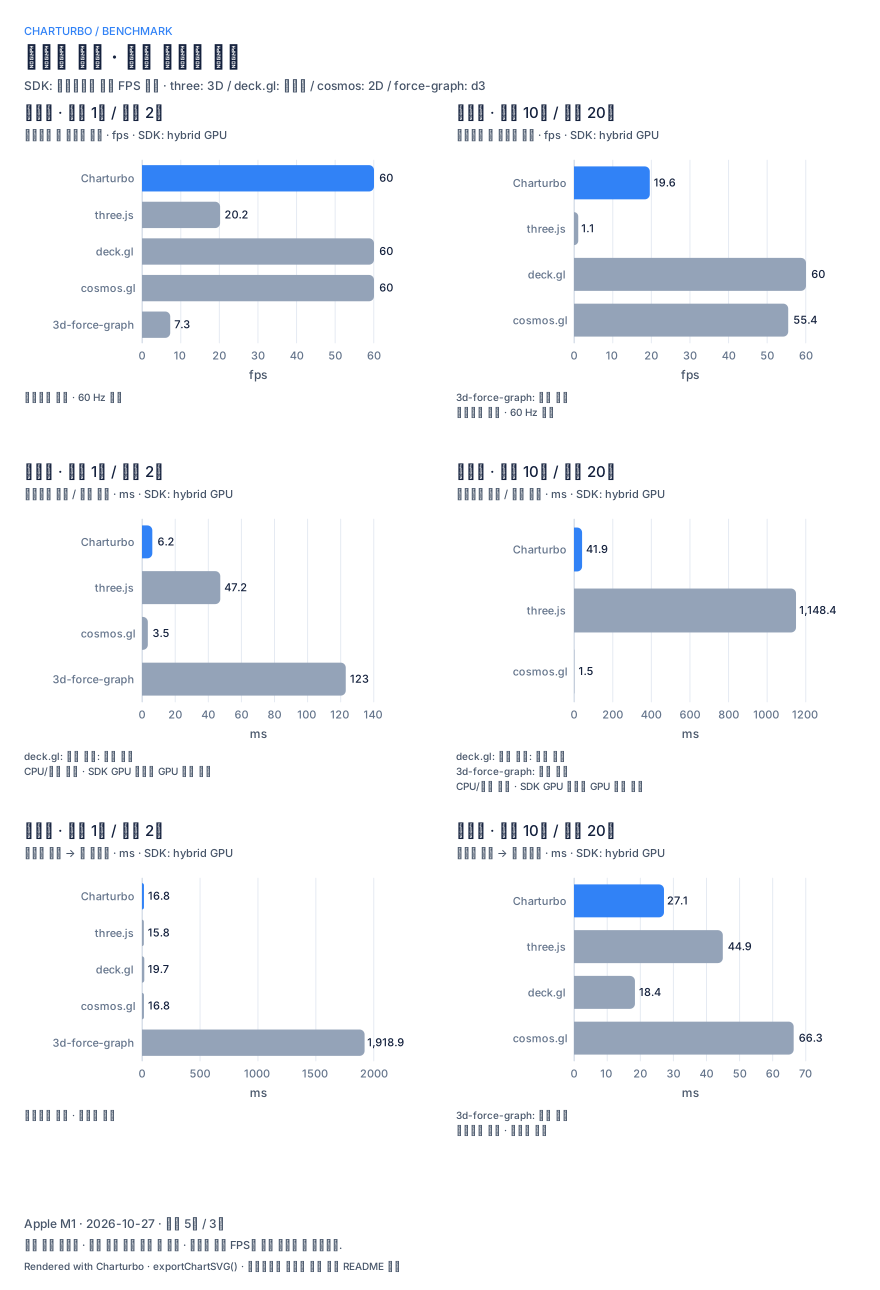
The comparison page web/examples/benchmarks.html reads results.json and draws horizontal bars with Charturbo.renderBarChart() on a shared CharturboDevice. It shows every scenario on one page with jump links, and a collapsible number table per scenario. The theme follows the theme selector in the examples site header (light · dark · midnight · paper). The raw tables remain even when no GPU is available.
npm run bench:charts runs the same chart code in Chrome and generates 6 light/dark SVGs with the SDK's exportChartSVG(). Only the outer title and measurement conditions are composited; bars · axes · labels are generated by the SDK. The GitHub README shows them as static images, and GitHub Pages shows them as real SDK charts with tooltips.
cd web
npm run examples:dev           # /benchmarks.html
npm run bench:charts          # needs Chrome; set the executable with CHROME_PATH
npm run bench:charts -- bench/out/results.json --out=bench/out/report
npm run bench:report:check    # checks scenarios · themes · styles · SVG · mobile browser
Failures, unsupported and unmeasured entries are not turned into 0; their name and reason are shown. The earlier SciChart TTFF (excluding the data copy), the earlier 3d-force-graph result whose physics run was not verified, and the cosmos v2 result with duplicated physics runs are excluded from the charts and marked as needing re-measurement.
On the comparison page and the README charts the SDK appears as a single Charturbo entry. Per scenario, among the valid CPU (viz) and hybrid GPU (vizgpu) measurements, the mode with the higher FPS is selected; on a tie, the mode with the shorter physics time. TTFF · FPS · physics time and the measurement conditions all come from that same selected run. The selected mode is shown in the table · tooltip · SVG, and the full CPU/GPU record is kept in the raw JSON/Markdown. This is a display rule for measurement results and does not mean the SDK runtime picks a mode automatically.
1. How to reproduce
cd web
npm install                  # the compared libraries are devDependencies (not included in the library bundle)
npm run bench                # full run: 5 reps (+1 warm-up), 3 s steady state, every scenario × WebGPU/WebGL2 + library comparison (~11 min)
npm run bench -- --quick     # smoke: 2 reps, 1 s, without the 10M / 5M / 4096² scenarios
npm run bench -- --filter=line-1m,scatter --backend=webgpu --no-compare
npm run bench -- --compare-only --libs=viz,uplot
npm run bench -- --shots     # screenshot of each page (web/bench/out/shots/) — to confirm a library actually drew
npm run bench -- --profile   # per-page CPU profile + top functions by self time
# smoke-test the new chart libraries only
npm run bench -- --quick --no-ours --libs=chartgpu,scichart,highcharts --out=bench/out/smoke
# smoke-test the new graph libraries only
npm run bench -- --quick --no-ours --filter=graph-10k --libs=viz,deckgl,cosmos,forcegraph3d --out=bench/out/smoke
# re-measure only the 3D graphs and merge (large data: up to 300 s per entry)
npm run bench -- --filter=graph --no-ours --merge=../docs/bench/results.json && npm run bench:charts
--merge=<results.json> merges this run's entries into an existing file (the same scenario + library/backend is replaced, everything else and meta are kept, and this run's conditions are appended to meta.partialRuns). The .md is rewritten from the merged result as well.
The runner (bench/run-bench.mjs) starts its own Vite server on a free port (cross-origin isolated: measureUserAgentSpecificMemory is available), launches headless Chrome (--headless=new --enable-unsafe-webgpu, --use-angle=metal on macOS, --js-flags=--expose-gc) with a unique profile, and opens each scenario in a new tab. Without Chrome it prints SKIPPED. If a page does not finish within 300 seconds (even when the main thread is blocked), it is recorded as FAILED: timeout together with the last reported phase, and the runner moves on.
2. Environment
| Item | Value |
|---|---|
| Machine | Apple M1 (8 cores), RAM 16 GB, macOS 15.1 (Darwin 24.1.0) |
| Browser | Chrome 156.0.8078.48, headless (--headless=new) |
| WebGPU adapter | apple / metal-3 |
| WebGL2 renderer | ANGLE (Apple, ANGLE Metal Renderer: Apple M1) |
| Canvas | 960×540 CSS px, DPR 1 (deviceScaleFactor: 1) |
| Frame interval | 60 Hz (median idle rAF interval 16.7 ms) |
| Node | v22.23.3 |
| Compared | uPlot 1.6.32, ECharts 6.1.0, Chart.js 4.6.1, Plotly gl2d 4.1.2, ChartGPU 0.4.0, SciChart 6.0.14, Highcharts 13.1.1, deck.gl 9.3.11, cosmos.gl 3.5.1, 3d-force-graph 1.80.1. three.js: initial record 0.170.0 → corrected comparison 0.186.1; see each measurement.version |
3. Method
Data
- All data is generated by a seeded PRNG (mulberry32,
bench/data.ts) — the same samples regardless of run · library · machine. Generation time is not measured. - Line: random walk (
line-<N>-<S>s= N samples in total, S series). Scatter: 3 Gaussian clusters. Bar 10k, heatmap 2048² / 4096², OHLC candles 1M, treemap 100k leaves, sankey 10k nodes. - Streaming (
stream-1m):appendSeriesDataof 10k points per frame into a 1M window (maxPoints: 1_000_000).
Phases (new tab per scenario)
- Engine creation (
Charturbo.create; for the compared libraries, library import + initialization) — recorded separately asinitMs. - TTFF: 5 full renders after 1 warm-up. Each run starts after two rAFs to align with the vsync boundary.
render call= duration of the synchronous render call (viz:renderXxxChart()+render(); uPlot/Chart.js: chart construction; ECharts:setOption(notMerge)→finished; Plotly:newPlotcompletion + 1 rAF)TTFF= call start → the moment the next frame is handed to the compositor (the task after rAF). It is quantized to the 60 Hz vsync, so compare differences under 16.7 ms with therender callcolumn.pixels= render + 1 px GPU readback (until the GPU work completes) — inresults.json.
- Memory: after two forced GCs,
performance.memory.usedJSHeapSize(JS heap),measureUserAgentSpecificMemory(UA memory: the whole page, JS + wasm etc.), the wasm memory size from engine stats and GPU buffer · texture bytes (Charturbo.getRenderStats()). - Steady state, 3 seconds: in a rAF loop, input is applied every frame and the rAF interval recorded.
dropped= number of missed vsyncs beyond 16.7 ms / number of measured frames,work= JS+wasm time spent on input handling + render in that frame,main thread ms/frame= increase of TaskDuration from CDPPerformance.getMetrics/ number of frames (including deferred work · layout).- viz scenarios: the real SDK gesture path — wheel zoom in (35%) → drag pan (30%) → wheel zoom out (35%). Charts without navigation (bar, treemap, sankey) use a hover sweep; streaming appends every frame.
- Library comparison: every library gets the same time-based window schedule (full → zoom in to a 1% window → pan the 1% window → zoom out to full) through its own range API (viz
setXRange/setYRange, uPlotsetScale, EChartsdataZoomaction, Chart.jsscales.min/max+update('none'), Plotlyrelayout). Scatter uses both x and y.
- Hover latency: in the reset full view, one pointer move per frame for 40 frames.
hover sync= event dispatch time (handlers that hit-test on the spot),interval p95= rAF interval during hover (including work deferred to timers / the next frame). - The repetition phase and the hover phase have budgets of 30 s / 10 s, so slow libraries on 10M data are measured at least 3 times only.
Library settings (fairness)
Each library uses its documented settings for large data (bench/others.ts).
| Library | Settings |
|---|---|
| viz | The same SDK calls as ours.ts, lineWidth: 1, scatter pointRadius: 1.5, opacity: 0.6, WebGPU. Lines use M4 LOD (min/max per pixel column) automatically |
| uPlot | Typed-array columns, points hidden (the line path already folds per pixel column). Scatter: mode: 2 + a custom rectangle drawer (as in the uPlot scatter demo — the built-in paths.points() builds one Path2D with 1M arcs, and screenshots confirmed Chrome draws nothing) |
| ECharts | canvas renderer, animation: false, typed-array data, line sampling: 'lttb', scatter/bar large: true, inside dataZoom |
| Chart.js | parsing: false, normalized: true, animation: false, the decimation plugin for lines (min-max), pointRadius: 0 (line) / 1.5 (scatter). The {x, y} object arrays are built once before measuring |
| Plotly | scattergl (WebGL) trace, gl2d bundle. No bar trace, so bar-10k is excluded |
| ChartGPU | WebGPU only, createChart + ECharts-style options, animation: false, typed-array { x, y } data. Line: type: 'line', sampling: 'lttb'. Scatter: type: 'scatter', symbolSize: 3. Bar: category axis + type: 'bar' (no zoom, hover sweep). Window moves use inside dataZoom + setZoomRange(start%, end%) — the arguments are percentages in [0, 100] (absolute x values converted to a fraction of the domain). Zoom is x-axis only, so the y window of the scatter schedule is not applied |
| SciChart | WebAssembly + WebGL2/WebGPU. SciChartSurface.configure({ wasmUrl, wasmNoSimdUrl }), UseCommunityLicense() (watermark). Line: FastLineRenderableSeries + MinMax resampling. Scatter: XyScatterRenderableSeries, explicit x/y ranges. Line/bar y axis auto-range. Bar: FastColumnRenderableSeries. Every measured render includes the wasm data copy of dataSeries.clear() + appendRange(), then nextStateRender() → invalidateElement() → await. The backend is checked after initialization with SciChartSurfaceBase.debugWasmWebGPU() |
| Highcharts | ESM build (highcharts/esm/highcharts.js) + side-effect import of the Boost module (highcharts/esm/modules/boost.js). Data as [x, y] tuple arrays (the Boost fast path). Bars use type: 'column'. boostThreshold: 5000 (GPU above 5k points), useGPUTranslations: true, usePreallocated: true. Window moves: xAxis.setExtremes(lo, hi, redraw, false), and the same on the y axis for scatter |
- The scope of
render calldiffers per library: viz reuses the engine and only passes the data again, uPlot / Chart.js destroy and rebuild the chart every run, and Plotly doespurge+newPlot. Engine/library initialization time is separate (initMs). - All libraries use the same padding (left 64 / right 24 / top 36 / bottom 36 px), 1 px lines and the same colors. Tooltips are on with each library's default hover behavior.
4. Results: charturbo scenarios
Steady state / dropped / work / hover / memory are WebGPU values (WebGL2 is fully in results.md — the steady state was nearly identical on both backends). GPU MB = allocated GPU buffer · texture size, upload/frame = average chart data upload per frame during the steady state.
| Scenario | Interaction | TTFF ms WebGPU / WebGL2 | Render call ms | Steady frame med / p95 / max ms | Dropped | Work per frame med ms | Hover sync ms | JS heap MB | wasm MB WebGPU / WebGL2 | GPU MB | Upload/frame |
|---|---|---|---|---|---|---|---|---|---|---|---|
| line-100k-1s | wheel+drag | 16.8 / 16.6 | 3.9 | 16.7 / 16.7 / 16.7 | 0/180 | 1.4 | 0.6 | 8.7 | 3.1 / 4.1 | 0.7 | 150 KB |
| line-100k-10s | wheel+drag | 16.7 / 17.8 | 5.8 | 16.7 / 16.7 / 16.7 | 0/180 | 1.4 | 0.8 | 9.1 | 8.4 / 13.0 | 2.3 | 633 KB |
| line-1m-1s | wheel+drag | 16.7 / 16.6 | 10.5 | 16.7 / 16.7 / 16.7 | 0/180 | 1.7 | 0.6 | 12.1 | 6.5 / 7.6 | 0.7 | 265 KB |
| line-1m-10s | wheel+drag | 17.1 / 17.2 | 16.7 | 16.7 / 16.7 / 16.7 | 0/180 | 3.2 | 1.0 | 16.0 | 9.6 / 22.9 | 2.3 | 1.5 MB |
| line-10m-1s | wheel+drag | 91.8 / 92.3 | 91.4 | 16.7 / 16.7 / 33.3 | 4/176 | 2.9 | 0.5 | 46.5 | 40.8 / 42.3 | 0.7 | 300 KB |
| line-10m-10s | wheel+drag | 72.9 / 73.4 | 72.5 | 16.7 / 16.7 / 33.3 | 6/175 | 4.8 | 1.2 | 84.6 | 78.7 / 86.9 | 2.3 | 2.6 MB |
| scatter-1m | wheel+drag | 46.1 / 46.9 | 45.4 | 16.7 / 16.7 / 16.7 | 0/180 | 1.2 | 0.9 | 15.9 | 55.7 / 113.5 | 32.7 | 736 B |
| scatter-5m | wheel+drag | 210 / 244 | 209 | 83.3 / 117 / 117 | 144/37 | 1.6 | 1.3 | 46.4 | 269.2 / 555.8 | 128.7 | 702 B |
| area-stacked-1m | wheel+drag | 26.9 / 25.6 | 26.4 | 16.7 / 16.7 / 33.3 | 1/179 | 5.5 | 0.9 | 16.0 | 39.4 / 64.6 | 5.3 | 4.3 MB |
| bar-10k | hover-sweep | 19.0 / 19.1 | 18.5 | 16.7 / 16.7 / 16.7 | 0/180 | 1.1 | 1.2 | 11.4 | 3.6 / 5.0 | 1.2 | 469 KB |
| heatmap-2048 | wheel+drag | 27.3 / 30.5 | 26.7 | 16.7 / 16.7 / 16.7 | 0/180 | 1.2 | 0.7 | 24.3 | 33.9 / 66.4 | 16.7 | 136 B |
| heatmap-4096 | wheel+drag | 92.9 / 96.4 | 92.1 | 16.7 / 16.7 / 16.7 | 0/180 | 1.3 | 0.7 | 72.3 | 129.9 / 258.4 | 64.7 | 136 B |
| candle-1m | wheel+drag | 33.2 / 33.3 | 32.8 | 16.7 / 16.7 / 16.7 | 0/180 | 1.6 | 0.8 | 23.5 | 40.4 / 40.9 | 0.7 | 80 KB |
| stream-1m | stream | 15.9 / 16.2 | 13.4 | 16.7 / 16.7 / 16.7 | 0/180 | 3.2 | 0.7 | 12.1 | 29.1 / 29.7 | 0.7 | 155 KB |
| treemap-100k | hover-sweep | 32.7 / 28.1 | 32.1 | 16.7 / 16.7 / 16.7 | 0/180 | 0.7 | 0.7 | 19.3 | 15.6 / 17.6 | 1.2 | 192 B |
| sankey-10k | hover-sweep | 100 / 81.0 | 99.2 | 16.7 / 16.7 / 16.7 | 0/180 | 0.7 | 0.7 | 11.2 | 99.9 / 140.4 | 64.7 | 7.2 KB |
Summary:
- Line · area · candle · bar · heatmap · treemap up to 1M held 60 fps during zoom/pan/hover (0–1 dropped). Work per frame was 1–6 ms.
- Line 10M: first frame 73–92 ms (copying 10M f32 into wasm + range computation + first M4 LOD), 3–5 ms of work per frame during zoom/pan, 4–6 frames dropped over 3 seconds.
- Streaming: 60 fps while appending 10k per frame into a 1M window (work 3.2 ms/frame; the upload is only the LOD result, ~155 KB/frame).
- Scatter 5M runs at 12–13 fps during zoom/pan (median frame interval 67–83 ms) and looks GPU-bound: JS+wasm work is 1.6 ms/frame, but rasterizing 5M point instances overruns the frame (no point LOD/density aggregation).
- Sankey 10k: hover emphasis only rewrites the GPU fill-emphasis uniform (48 B) and the vertices of nodes · links entering or leaving the lit set, so during the hover sweep the upload dropped from ~40 MB → ~7 KB per frame and the synchronous hover handling from 14.5 ms → 0.7 ms (same on WebGPU / WebGL2; the screen is pixel-identical to before). Treemap legend emphasis changes the same uniform only (sunburst hover still re-tessellates the arcs).
- The WebGL2 fallback has nearly the same TTFF and steady state as WebGPU, but its wasm memory peak is 1.6–2.4× larger for scatter · heatmap · multi-series (presumably extra staging copies in the GL backend path; wasm memory does not shrink, so these are peak values).
5. Initial record: library comparison (2026-10-26, viz = WebGPU)
The tables and interpretation below are the record of the first 5-library comparison. For the latest full comparison of 8 libraries, see the generated table and the SDK comparison page.
line-1m-1s
| Library | Renderer | Render call ms | TTFF ms (p95) | Steady frame med / p95 / max ms | fps | Dropped | Main thread ms/frame | Hover sync ms / interval p95 ms | JS heap MB | UA memory MB |
|---|---|---|---|---|---|---|---|---|---|---|
| viz 0.1.0 | webgpu | 13.3 | 15.9 (16.6) | 16.7 / 16.7 / 16.7 | 60 | 0/180 | 2.7 | 0.6 / 16.7 | 19.8 | 26.5 |
| uplot 1.6.32 | canvas2d | 13.3 | 15.5 (16.0) | 16.7 / 16.7 / 16.7 | 60 | 0/180 | 3.0 | 0.1 / 16.7 | 20.2 | 27.4 |
| echarts 6.1.0 | canvas2d | 22.4 | 22.8 (31.8) | 16.7 / 16.7 / 33.3 | 59.7 | 1/179 | 6.5 | 0.9 / 16.7 | 80.0 | 95.3 |
| chartjs 4.6.1 | canvas2d | 17.1 | 17.4 (20.3) | 16.7 / 16.7 / 16.7 | 60 | 0/180 | 4.0 | 0.1 / 16.7 | 57.3 | 63.5 |
| plotly 4.1.2 | webgl | 285 | 298 (367) | 16.7 / 16.7 / 16.7 | 60 | 0/180 | 2.5 | 0.1 / 4300 | 132.4 | 315.4 |
line-10m-1s
| Library | Renderer | Render call ms | TTFF ms (p95) | Steady frame med / p95 / max ms | fps | Dropped | Main thread ms/frame | Hover sync ms / interval p95 ms | JS heap MB | UA memory MB |
|---|---|---|---|---|---|---|---|---|---|---|
| viz 0.1.0 | webgpu | 91.8 | 92.1 (92.6) | 16.7 / 16.7 / 33.3 | 58.7 | 4/176 | 7.0 | 0.6 / 16.7 | 122.8 | 129.5 |
| uplot 1.6.32 | canvas2d | 81.3 | 81.7 (84.2) | 16.7 / 33.3 / 83.3 | 52.8 | 22/160 | 9.4 | 0.1 / 16.7 | 123.2 | 130.4 |
| echarts 6.1.0 | canvas2d | 133 | 133 (142) | 33.3 / 83.3 / 183 | 30.8 | 88/92 | 32.6 | 0.9 / 16.7 | 526.3 | 541.6 |
| chartjs 4.6.1 | canvas2d | 114 | 114 (118) | 16.7 / 33.3 / 100.0 | 52.1 | 24/157 | 10.0 | 0.0 / 16.7 | 469.4 | 475.6 |
| plotly 4.1.2 | - | Failed: timeout after 300 s (page was in phase "steady") |
scatter-1m
| Library | Renderer | Render call ms | TTFF ms (p95) | Steady frame med / p95 / max ms | fps | Dropped | Main thread ms/frame | Hover sync ms / interval p95 ms | JS heap MB | UA memory MB |
|---|---|---|---|---|---|---|---|---|---|---|
| viz 0.1.0 | webgpu | 42.8 | 43.3 (53.6) | 16.7 / 16.7 / 33.3 | 59.7 | 1/179 | 1.8 | 1.0 / 33.3 | 15.9 | 22.7 |
| uplot 1.6.32 | canvas2d | 317 | 319 (323) | 16.7 / 33.3 / 300 | 44.6 | 49/141 | 13.6 | 0.1 / 16.7 | 16.4 | 23.6 |
| echarts 6.1.0 | canvas2d | 1035 | 1050 (1117) | 133 / 150 / 150 | 7.8 | 161/23 | 134 | 0.4 / 16.7 | 91.8 | 109.1 |
| chartjs 4.6.1 | canvas2d | 662 | 665 (670) | 283 / 617 / 617 | 3.2 | 193/10 | 339 | 0.0 / 383 | 201.8 | 208.0 |
| plotly 4.1.2 | webgl | 303 | 316 (332) | 16.7 / 16.7 / 33.3 | 58.3 | 5/175 | 16.2 | 0.1 / 16.7 | 124.3 | 307.3 |
bar-10k
| Library | Renderer | Render call ms | TTFF ms (p95) | Steady frame med / p95 / max ms | fps | Dropped | Main thread ms/frame | Hover sync ms / interval p95 ms | JS heap MB | UA memory MB |
|---|---|---|---|---|---|---|---|---|---|---|
| viz 0.1.0 | webgpu | 19.1 | 19.6 (21.2) | 16.7 / 16.7 / 16.7 | 60 | 0/180 | 2.1 | 1.7 / 16.7 | 11.5 | 18.2 |
| uplot 1.6.32 | canvas2d | 3.2 | 16.8 (18.6) | 16.7 / 16.7 / 16.7 | 60 | 0/180 | 1.2 | 0.1 / 16.7 | 9.2 | 16.4 |
| echarts 6.1.0 | canvas2d | 67.4 | 83.4 (83.8) | 16.7 / 16.7 / 16.7 | 60 | 0/180 | 3.4 | 1.6 / 16.7 | 31.9 | 49.2 |
| chartjs 4.6.1 | canvas2d | 49.1 | 50.5 (54.7) | 33.3 / 33.3 / 66.7 | 37.6 | 68/113 | 26.9 | 0.0 / 16.7 | 14.0 | 20.2 |
| plotly 4.1.2 | - | Failed: Error: unsupported: the plotly gl2d bundle has no bar trace |
Interpretation — where it wins and where it loses
- Scatter 1M: viz is the fastest. Render call 43 ms vs Plotly 303 ms · uPlot 317 ms · Chart.js 662 ms · ECharts 1035 ms; 60 fps during zoom/pan (1 dropped) vs Plotly 58 fps, uPlot 45 fps, ECharts 8 fps, Chart.js 3 fps. Memory is also the smallest (UA 22.7 MB vs Plotly 307 MB).
- Line 10M: viz has the smoothest zoom/pan (4 dropped vs uPlot 22, Chart.js 24, ECharts 88; p95 frame 16.7 ms vs 33–83 ms). But uPlot renders the first frame faster (81 ms vs 92 ms). Plotly's zoom phase did not finish within 300 seconds at 10M and was recorded as a failure (every
relayoutreprocesses everything). - Line 1M: viz and uPlot are effectively tied (render call 13.3 ms for both, both 60 fps). Chart.js (decimation) also holds 60 fps; ECharts renders in 22 ms with 1 dropped. Plotly takes ~300 ms for the first render and its hover interval p95 is 4.3 seconds (the main thread stalls while handling hover).
- Bar 10k: uPlot wins — render call 3.2 ms vs viz 19.1 ms (TTFF 16.8 vs 19.6 ms), hover sync 0.1 vs 1.7 ms. Both hold 60 fps. The cause on the viz side (bar layout · axes · DOM overlay) has not been analyzed yet (check with
--profile). Chart.js runs at 38 fps during the hover sweep. - JS heap: for line 1M/10M, viz and uPlot are similar (mostly the input Float32Array itself). ECharts / Chart.js use 470–530 MB at 10M.
- viz's GPU memory is not included in UA memory (see the
GPU MBcolumn).
6. Graph method and initial record
The graph-10k and graph-100k scenarios (bench/graph.ts, runGraph in main.ts). The initial number tables · interpretation below are the viz/three.js record of 2026-10-26. For the latest numbers of the 6 comparison rows split by CPU/GPU and their failure reasons, see the generated table.
Method
- Data: the demo app's seeded generator (
GraphDatasetTS.generateSeeded, xorshift, seed 42) — N nodes, 2N edges (80% inside the same cluster), 8 clusters, a space of radius 100. Generation is not measured. Both engines receive the same TypedArray buffers throughloadRawDataset. - Engines: the adapters used by the demo comparison screen are used as-is (
src/adapters/rust-wgpu-adapter.ts,src/adapters/three-js-adapter.ts, physics insrc/three-engine/octree-physics.ts). No benchmark-specific tuning. The additional comparison adapters exist only inbench/graph.ts(implementing theEngineAdapterinterface).- viz: Rust Barnes-Hut (wasm, single thread) + WebGPU, nodes as sphere billboard impostors (one quad), edges as lines.
- vizgpu: the same 3D Barnes-Hut model · data · renderer. A hybrid path (
stepPhysicsAsync) that computes repulsion on the GPU and reads it back to the CPU every step to update springs · integration · the spatial index. Not a GPU-resident simulation. - three.js: a JS Barnes-Hut octree with the same algorithm +
InstancedMeshnodes (8×6-segment spheres,MeshLambertMaterial) +LineSegmentsedges, WebGL2 (ANGLE Metal). - deck.gl:
ScatterplotLayer(nodes) +LineLayer(edges),OrbitView, WebGL2. No layout engine — nodes stay at the initial positions fromloadRawDataset.tick()only redraws. Measures the pure GPU render cost. - cosmos.gl: WebGL2 GPU force-directed layout, 2D only. Drops z from the input coordinates and uses x · y only. Applies
enableRenderLoop: falsetogether withpause()and drives frames by hand withstep()+renderOneFrame(). From v3, it verifies that coordinates stay unchanged when only one physics step · a finite coordinate move · a render are done. The earlier v2 also ran physics inrenderOneFrame(), so it did two steps per frame. The algorithm differs from the viz/three.js 3D Barnes-Hut (GPU repulsion + springs, not d3-style). - 3d-force-graph: d3-force-3d layout (Barnes-Hut for the many-body repulsion; forces and integration differ from viz), three.js 0.186 + WebGL2. RAF is stopped and frames are driven by hand with the scene's
ThreeForceGraph.tickFrame()+renderer().render(). The top-level public API has notickFrame(), so the scene object is inspected, and the measurement fails if it is missing.
- Same conditions (viz · three.js): force model and constants (repulsion 25, spring 0.08 / rest length 8, center attraction 0.03, damping 0.88, θ 0.75, softening 1.5, max velocity 60, octree max depth 10), fixed dt 0.016 per frame, camera (distance 220, yaw 0.4, pitch 0.3, fov 45), 960×540 canvas @ DPR 1, auto-sleep off.
- deck.gl conditions: the same initial position data passed through
loadRawDatasetand kept fixed (no physics).rotationOrbitofOrbitViewis in degrees, initial zoom 1. No camera distance concept (replaced by the zoom level). - cosmos.gl conditions: the same initial x · y coordinates (z dropped).
spaceSize: 4096,simulationRepulsion: 1,simulationLinkSpring: 1,simulationGravity: 0.25,simulationDecay: 1000,simulationFriction: 0.85. 2D, so no camera rotation (rotateCamerais a no-op). - 3d-force-graph conditions: the same node · edge data, d3-force-3d default forces (different from the viz/three.js constants).
cooldownTicks/Time: Infinity,d3AlphaMin: 0,warmupTicks: 0, automatic RAF stopped. Data loading waits foronFinishUpdate, so it includes scene creation · the first render. One verification step right before the steady state checks oneonEngineTickcall and actual node movement, recorded inphysicsValidation. The verification step is excluded from the timing samples. Initial camera distance 220, yaw 0.4, pitch 0.3. - Phases:
init= engine creation (viz creates all GPU pipelines here).cold= first data load + first frame shown on a new engine (measured once). three.js compiles shaders on the first render, so that cost goes intocold, while for viz it goes intoinit. Comparing cold alone therefore favors viz;init + coldis fairer (10k: 47.6 vs 123.8 ms, 100k: 86.5 vs 124.3 ms; three.js init also includes the dynamic module import).TTFF= reload of the same buffers (positions reset) + first frame shown, median of 5 after 1 warm-up. Quantized to 60 Hz.- Steady state, 3 seconds: every frame
tick(0.016, true)(one Barnes-Hut step + buffer sync + draw) and a camera orbit by elapsed time (half a turn in 3 seconds).physics= step time,render= sync + draw submission time (GPU execution is asynchronous and not included — it shows up in the frame interval). fps is the reference metric. When frame work slightly exceeds 16.7 ms, rAF intervals alternate between 16.7 / 33.3 ms and the median can show 16.7 ms (viz 10k). - Memory: after the steady state and a forced GC, JS heap, wasm memory (viz), UA memory.
In the steady-state loop vizgpu waits for each asynchronous step to complete before rendering. Its physics time is the elapsed time including snapshot creation · upload · GPU completion · readback · CPU springs/integration · index rebuild. Its scope differs from the CPU execution/submission time of the other rows. The GPU compute pipelines are created lazily on the first physics call, so they are not included in the render-only init/cold/TTFF; that cost is paid in the verification step right before the steady state. reps=5 is the number of TTFF repetitions; steady-state FPS/physics time come from one 3-second run.
2026-10-27 improvement: CPU traversal + hybrid GPU
Same Apple M1 / Chrome 156 / 60 Hz environment, seed 42, 3-second steady-state runs. Before and after runs were measured sequentially, not as merged numbers over repeated rounds.
| Nodes / edges | Before: CPU physics ms / FPS | After: CPU physics ms / FPS | Hybrid GPU physics ms / FPS |
|---|---|---|---|
| 10k / 20k | 21.48 / 43.8 | 17.74 / 52.7 | 6.23 / 60.0 |
| 100k / 200k | 310.30 / 3.5 | 285.76 / 3.7 | 41.87 / 19.6 |
- The CPU caches centers of mass at rebuild time and traverses stack-free with small DFS records and escape indexes. Regression tests confirmed the traversal order and results are unchanged. A separate run right after the CPU change gave 10k 17.71 ms / 52.4 FPS and 100k 272.28 ms / 3.9 FPS.
- Hybrid physics is about 3.4× faster than before at 10k and about 7.4× at 100k. 100k FPS is about 5.6×. The cost of CPU tree rebuild · integration, the per-step readback and the render upload remains.
- The corrected cosmos (v3) ran at 60 FPS at 10k and 55.4 FPS at 100k. It uses a 2D force approximation and integration that differ, so this is not an equal-quality 3D comparison. cosmos's physics submission time (3.52 / 1.51 ms), which does not include GPU execution, must not be compared directly with the hybrid round-trip time.
- Compared with the CPU on a real GPU/WASM, including nodes · pins stacked at the same position: for 64 nodes/8 steps (exact), 1k/16, 10k/8 and 100k/3, the maximum coordinate errors were 0, 0.00000382, 0.00000763 and 0.0000611. Picking after async completion, stale-result rejection, concurrent calls, dispose, sleep, shared device and the WebGL2 fallback were also verified.
- Current results are merged into
bench/results.json. The before/after raw files are the localweb/bench/out/graph-before.json,graph-cpu-after.jsonandgraph-after.json.
WARNING
The table and notes above record the 2026-10-27 hybrid path (GPU repulsion + per-step readback, then CPU springs · integration · spatial index). stepPhysicsAsync() has since become a GPU-resident layout: positions and velocities stay in GPU buffers, and the Barnes-Hut octree build · repulsion · springs · integration · auto-sleep run on the GPU. The Promise resolves at submission rather than after readback, and CPU edits during GPU work (moveNode, pinNode, styles, loadDataset, stepPhysics) are applied in order instead of being rejected. When you need current positions, for picking · export for example, await syncPhysicsPositions(). See 3D Network Graph for the current behavior.
const gpuAvailable = sdk.supportsGpuPhysics();
await sdk.stepPhysicsAsync(0.016); // resolves at submission; CPU fallback on WebGL2
sdk.render();
await sdk.syncPhysicsPositions(); // bring the CPU copy up to date before picking · export
stepPhysics() stays on the CPU path. Await each asynchronous call before starting the next step (calling again while one is pending throws A physics step is already pending). If the GPU buffer/dispatch limits are exceeded, the Promise rejects (Graph exceeds GPU layout buffer/dispatch limits). It does not render automatically. The default full WASM build keeps the WebGL2 fallback; only the WebGPU-only build uses --no-default-features.
cd web
npm run wasm:build
npm run bench:physics:check
npm run bench -- --filter=graph --compare-only --libs=viz,vizgpu,cosmos --backend=webgpu --reps=5 --warmup=1 --duration=3000 --out=bench/out/graph-after
graph-10k (10,000 nodes · 20,000 edges)
| Engine | Renderer | Init ms | cold ms | TTFF ms (p95) | fps | Steady frame med / p95 / max ms | Dropped | Physics med (p95) ms | Render med (p95) ms | JS heap MB | wasm MB | UA memory MB |
|---|---|---|---|---|---|---|---|---|---|---|---|---|
| viz 0.1.0 | webgpu | 30 | 17.6 | 16.7 (17.4) | 41.9 | 16.7 / 33.3 / 50.0 | 55/126 | 22.3 (23.1) | 1.0 (1.2) | 8.7 | 7.1 | 15.4 |
| three.js 0.170.0 | webgl2 | 87 | 36.8 | 16.8 (17.7) | 16.3 | 66.7 / 83.3 / 100 | 134/49 | 56.4 (81.4) | 0.9 (2.1) | 25.8 | - | 40.5 |
graph-100k (100,000 nodes · 200,000 edges)
| Engine | Renderer | Init ms | cold ms | TTFF ms (p95) | fps | Steady frame med / p95 / max ms | Dropped | Physics med (p95) ms | Render med (p95) ms | JS heap MB | wasm MB | UA memory MB |
|---|---|---|---|---|---|---|---|---|---|---|---|---|
| viz 0.1.0 | webgpu | 23 | 63.5 | 23.5 (38.9) | 3.0 | 367 / 383 / 383 | 190/9 | 361 (381) | 5.9 (7.9) | 13.6 | 63.0 | 20.4 |
| three.js 0.170.0 | webgl2 | 37 | 87.3 | 54.5 (60.4) | 0.8 | 1833 / 1833 / 1833 | 218/2 | 1799 (1818) | 30.0 (30.7) | 114.2 | - | 128.8 |
Interpretation
- The physics step accounts for most of the difference: Rust/wasm runs the same Barnes-Hut 2.5× faster than JS at 10k (22 vs 56 ms) and 5× faster at 100k (361 vs 1799 ms). So fps during simulation + rotation at 10k is 41.9 vs 16.3.
- Neither is real-time at 100k. Running physics every frame, viz also drops to 3 fps (three.js 0.8 fps). Use a 100k graph by laying it out in advance with
warmup()and then only rendering, or by running physics once every few frames (render-only fps was not measured in this scenario; render submission time per frame is 5.9 vs 30 ms). - First frame: at 10k both fit in one frame (16.7 vs 16.8 ms, effectively tied due to vsync quantization). At 100k it is 23.5 vs 54.5 ms, and cold is 63.5 vs 87.3 ms.
- Memory: the three.js side has a 114 MB JS heap at 100k because of its data structure (
GraphDatasetTS) that keeps a JS object per node. viz has a 13.6 MB JS heap + 63 MB wasm memory (wasm memory does not shrink, so this is the peak including repeated loads). GPU memory is not included in the tables above for either side (viz engine-reported GPU buffers 3.1 / 20.6 MB; three.js has no byte counter).
Fairness notes (known handicaps of the three.js implementation)
The three.js side uses the demo comparison screen's implementation untouched. It follows the usual three.js setup for large graphs (InstancedMesh nodes + LineSegments edges, the same Barnes-Hut), but some parts leave room for more optimization.
- Physics (
octree-physics.ts): nodes are kept as an array of objects (AoS); for every nodecomputeRepulsionallocates a new[fx, fy, fz]array and a traversal stack array, and the octree cells are rebuilt as objects every step (GC pressure). Switching to flat TypedArrays + a reused stack could reduce the JS physics time. What was measured is "a plain JS implementation of the same algorithm", not an optimized JS implementation. - Render (
three-js-adapter.tssyncBuffers): every frame rewritessetColorAtfor every node and the edge color buffer even when colors do not change (part of the 30 ms render at 100k). - Node geometry differs: viz uses a quad impostor, three.js an 80-triangle sphere mesh (
SphereGeometry(1, 8, 6), Lambert lighting). At 100k, three.js sends more triangles to the GPU. Frame time here is dominated by physics, so the effect is small, but for a render-only comparisonTHREE.Points+ a sprite shader would be closer. - Algorithm details (negligible performance impact): Rust applies damping as
damping^(dt·60)(0.88^0.96 at dt 0.016), JS multiplies by 0.88 every step. The Rust octree keeps nodes stacked at the maximum depth in a linked list, JS drops them. The three.js adapter'stickincludes an O(N) kinetic energy sum in thephysicstime (about 1 ms at 100k). - The on-screen colors differ (three.js sRGB output conversion and Lambert lighting, background color). Unrelated to performance.
- Synchronous viz physics is single-threaded wasm (no SIMD · threads). Only the optional
vizgpuuses GPU compute for repulsion.
7. Bottleneck fixes in this work (before → after)
Before = the source before these fixes + a build with only the stats counters added; after = the current source. Before/after were run alternately for 3 rounds on the same machine (WebGPU, 5 reps, 2-second steady state); values are medians of the samples merged across rounds. Command per round: npm run bench -- --no-compare --backend=webgpu --filter=line-1m-1s,line-10m,area-stacked-1m,candle-1m,scatter-1m,stream-1m --reps=5 --duration=2000.
| Scenario | Render call ms (before → after) | TTFF ms | Steady work med ms | Steady work p95 ms | Main thread ms/frame | Dropped frames (sum of 3) | wasm MB |
|---|---|---|---|---|---|---|---|
| line-1m-1s | 21.5 → 13 (-40%) | 22 → 15.3 | 2 → 2 | 4.7 → 5 | 3 → 3 | 0 → 0 | 9.5 → 6.5 |
| line-10m-1s | 109 → 91.8 (-16%) | 109 → 92.2 | 5 → 4.8 | 19.3 → 20.4 | 8.5 → 8.5 | 9 → 11 | 78.1 → 40.8 |
| line-10m-10s | 125 → 74.8 (-40%) | 125 → 75.3 | 9.4 → 6.7 | 25.8 → 21.4 | 13.3 → 10.2 | 36 → 13 | 78.7 → 78.7 |
| scatter-1m | 46 → 39.9 (-13%) | 46.5 → 40.4 | 1.1 → 1 | 1.9 → 1.7 | 1.8 → 1.6 | 0 → 0 | 55.7 → 55.7 |
| area-stacked-1m | 36.3 → 26.5 (-27%) | 36.8 → 26.9 | 7.4 → 6.5 | 13.4 → 11 | 9 → 8.1 | 0 → 0 | 37.8 → 39.4 |
| candle-1m | 58.3 → 35 (-40%) | 58.7 → 35.4 | 3.2 → 2.9 | 13 → 7.7 | 5.6 → 4.3 | 1 → 0 | 40.4 → 40.4 |
| stream-1m | 22.8 → 13.6 (-40%) | 23.2 → 16.4 | 3.9 → 3.2 | 8.2 → 6.1 | 4.9 → 4.4 | 0 → 0 | 32.5 → 29.1 |
What changed (all results identical — compared against the previous implementation in unit tests):
- min/max without NaN handling (
chart/finite.rs,line.rs,candle.rs,scatter.rs):f32::min/maxfall back to a slow sequence on wasm32 for every comparison because of NaN operand handling. Values that already passed anis_finitecheck use a plain compare-select (2–3× faster). - Single-pass line extents (
line.rsextents): finite min/max and positive min/max (for log axes) went from 2 passes to 1 pass per series. - M4 LOD inner loop (
line.rspush_m4): the current min/max values are kept in registers (previously re-read by index for every sample), with the same keep-first-index-on-tie rule. This is the hot loop that walks every visible sample on every zoom/pan frame. - No copy for a single series (
charturbo.ts,lib.rs): one series +Float32Array(andFloat64Arrayx) is passed as-is without building a new concatenated array, and the Rust side owns theVecthat wasm-bindgen already copied instead of copying a second time → wasm memory for a 10M single series 78 → 41 MB. - Shared O(n) pass for accessibility summaries (
chart-a11y.tswithPassMemo): the summary and the description used to compute the same series statistics separately within one update; they are now memoized only within that update (if the data changes in place, the next update computes them again). - Render stats API (
renderer/stats.rs,lib_stats.rs,chart-stats.ts,Charturbo.getRenderStats()): GPU buffer/texture bytes, chart upload bytes per frame, mark counts per layer, wasm memory size. For benchmarks and diagnostics (no change to rendering).
Not improved: for line-10m-1s, steady work p95 and the dropped count are unchanged or within noise (9 → 11). Most of the remaining 10M first-render time is the JS → wasm copy and the first LOD.
8. Limits and caveats
- These are results from one machine (Apple M1, headless Chrome 156, 60 Hz). Headless Chrome may produce frames differently from real display compositing, and numbers will differ on 120 Hz displays · other GPUs · Windows/Linux · Firefox/Safari.
- TTFF and frame intervals are quantized to vsync (16.7 ms). For small data, "16.7 ms" means "within one frame", and the render call column is more precise.
- GPU execution time is not measured directly (no timestamp queries).
pixels(1 px readback) and frame intervals show GPU-bound situations indirectly (e.g. scatter-5m). - Synthetic input (dispatched Pointer/Wheel events) and a time-based schedule are used. Real user input latency (input → screen) is not measured.
- The
render callscope differs between libraries in the comparison (section 3 above). Each library uses its documented large-data settings, but not every possible tuning was tried (e.g. a quadtree for uPlot scatter, tuning EChartsprogressive, no decimation for Chart.js scatter). Improvement suggestions can go intobench/others.ts. - Plotly line-10m failed with the 300-second timeout, and bar-10k was excluded because the gl2d bundle has no bar trace.
- The 3D graph comparison compares whole engines (data structures + physics + render). It is not a comparison of three.js's own render performance; the handicaps of the three.js implementation are listed in section 6. The three.js steady state at graph-100k has only 2 frames in 3 seconds, so fps 0.8 is a rough value.
- The additional graph libraries do not do the same work as viz/three.js: deck.gl only renders without physics (
physics0 ms), cosmos.gl is a 2D GPU layout (z dropped, no camera rotation), 3d-force-graph uses d3-force-3d (a different force model and constants). Do not compare fps directly; look at thephysics/rendercolumns separately. - ChartGPU is WebGPU-only and its zoom supports the x axis only, so the scatter y window is missing. The SciChart community license draws a watermark, and the actually selected backend is recorded in the results. Highcharts has a commercial license, and its Boost threshold is 5,000.
- Measurement corrections: the earlier SciChart ~33 ms TTFF measured only the redraw after the data copy had finished during initialization. The earlier 3d-force-graph ~55 FPS / 0.01 ms physics came from only calling
d3ReheatSimulation()on a stopped simulation. The earlier description that read these as correct data-load · physics performance was wrong. The corrected adapters recordmethodologyVersion: 2and are replaced by re-measured results. - The top-level
metaof a merged file is the environment of the first run. Check each new comparison entry's ownmeasurement. When older records are fed in, mixed conditions · unverified results are flagged, and a uniform 5 runs · 3 seconds is not assumed. - Memory: the JS heap is the post-GC value; wasm memory does not shrink, so it is the peak including warm-up. GPU bytes are the capacity allocated by the viz engine and do not include driver overhead.
- Noise in the before/after comparison: render call variance between repeats of the same scenario is roughly ±5%, dropped frames ± a few frames.